
Exercise 2
Part 1 Terrestrial Laser Scanning
Dataset
TLS: originally consisting of 25 scan positions, linked using reflectors. We have two datasets MLS: Clip from scanned area using simultaneous localization and mapping (SLAM).
SLAM is a computational technique that uses different types of sensors (in this case, points from LIDAR) to create a virtual map and locate itself in the map simultaneously(real-time).
1. Investigating the pointcloud
Scalar Fields标量字段
- Edge of Flight Line: Because the data is collected from a ground-based TLS, the scalar fields Edge of Flight Line is not meaningful. It says where the point is located at the flight line.
- Number of Returns is the total number of returns for a given pulse.
- Return Number is the order. They are marked in the sequence of returns. the first return will have a return number of one, the second a return number of two, and so on.
- The Intensity is the measured backscatter values connected to the distance of objects to the sensor. The recorded intensity changes as the distance increases between the target and the LiDAR system.
- The GPS Time refers to the number of points for a given time measurements by a rotating scanner.
High intensity(hard硬的> stems of trees),Low intensity(soft软的> leaves)
returns
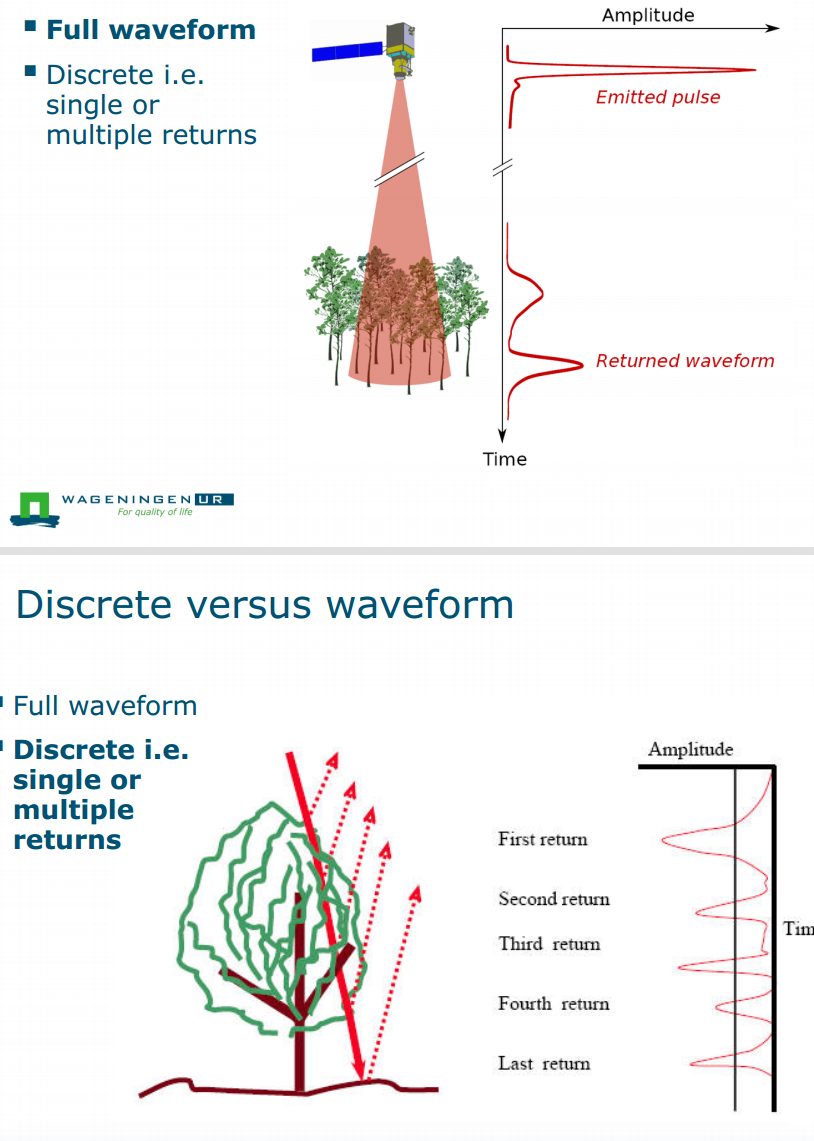
The ==first return== refers to the first recorded return of the objects closest to the sensor (in case of ground-based TLS). Then highly reflective objects (with rough surface) that reflect the light in multiple directions can represent ==more than one return==. When the light passes along the objects like trees, with gaps between leaves and branches, it travels further and reflects from objects behind the leaves, like from branches and stems. The last object recorded for a pulse is called ==last return==.
2.Aligning TLS & MLS data
georeferenced
- Due to the forest environment, GNSS reception with the MLS device was poor and therefore it could not directly be georeferenced.
- For the TLS data a –pretty tedious- procedure was followed, using surveying techniques to measure the coordinates of some control points. Luckily, we can register the different point clouds to each other.
3.Compare TLS & MLS
- The difference can be seen in the density of leaves in the canopy, TLS recorded more leaves on the tree compared to the MLS.
- The difference between TLS and MLS, is that MLS has lower measurement accuracy. With the TLS multiple measurements can be made from the same position.
- Moreover, TLS used reflectors to determine the object position.
4.C2C distance calculation
With the C2C (cloud to cloud comparison) tool you calculate the distance from every point in the reference pointcloud to the closest point in the other pointcloud. This is a nice tool to investigate if there are differences in structure between both pointclouds.
- The missing points in the MLS measurement is observed with the increase in distance between points. MLS did not record the top of the canopy and the tower.
- ==reflectors== used for TLS can be seen with the heights of 1.63 meters
- ==TLS_2011 as reference:== shows the growth of the canopy from green to red.
- ==TLS_2021 as reference==: shows the materials that disappeared. At the bottom of the canopy the branches fell off and some trees might have fallen over.
Part 2 Processing of Airborne Laser Scanning data
spatial extent, intensity pattern, Classification
建筑相关
Maximum Height, Minimum Height and Object Height
Do all buildings have points on all the side walls?
No, they don’t. It depends on the scanangle (how oblique the scanner looks) and the direction from which it scans. Some walls hardly have points on them.
可以从object height看出建筑高度吗?
不能!They seem to have no height on the roof area. This is because there are no hits on the ground. Therefore, the lowest point is also on the roof and the difference between the highest and lowest points is 0 m.
Points Density点密度的变化取决于什么?
- Point density refers to the returns per square meter, with more returns recorded for the complex structures like trees. The variation of point density is thus dependent on the ==structure of the object. ==
- We can see some patterns due to ==overlapping scan lines. ==
为什么Relative Point Density长这个样子
(Why does the relative density show spatial patterns? What causes this spatial variation in Ground point density?)
- Relative density refers to the proportion of the total points that are considered ==ground points==.
- When there is no vegetation all points are located on the ground and classified as ground points. All the locations where the relative point density is low there is vegetation. This may result in a bit less points on the ground, but mainly results in many additional returns from the vegetation.
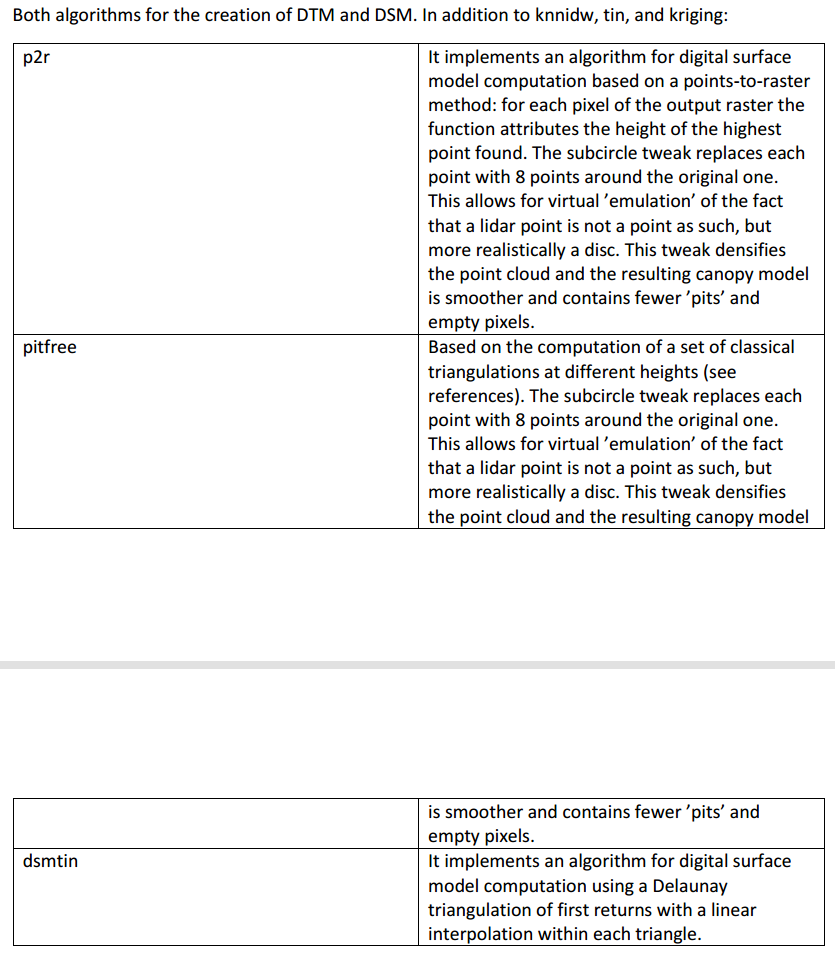
DTM Creation
Interpolation methods插值方法
![[f81651a17d02eaed67f73dc3e757d8b.png]]
不同插值方法的影响:DTM Difference using different interpolation options
In the difference plot the values around steep slopes within short distance are noticeable. There the lowest point on the m2 area is lower than the mean point.
CHM Creation
**CHM gives absolute height **
Different algorithms
Simple Terrain Correction
Gap fraction: Gap fraction is defined as the fraction of sky visible through the canopy
segmentation 森林里的树的时候有什么问题
- sometimes trees are split into several clusters.
- Some parameter tuning may help here, but if trees have multiple local maxima it will be hard not to get any double trees.
- Distinguishing individual trees in a forest stand is not that easy, there will always be quite some confusion, since you have no topological information.
- You only have individual points and you are not sure which point belongs to which tree.
Relation between tree height and crown dimension
几乎没什么关系,but It seems that the relation between tree height and crown area varies per tree species. It is not very strong, but trees with a large crown area tend to be high. However, a high tree does not necessarily have a large crown area.
Relation between tree height and crown dimension in urban area and forest region
- When trees have more space to grow (like in the “urban” example), there are less trees that are high but also having a large crown area. When a tree grows taller the crown becomes bigger as well.
- This is not the case in a forest, where a tree can be high, but with a small crown size.
- However, ]the results you get here depend for a large part on the tree segmentation algorithm, which is far from perfect in the forest area. 不太确定,但是也不一定全错
为什么几乎没关系:
- It is logical that forest area would have less relation between tree height and crown dimension, because of the phenomenon of crown shyness.
- The crowns of trees do not touch each other, so there is a limit to the crown growth.
- Also, the same tree species might have different crown size depending on how much room there is to grow.
Urban
In urban areas, there is more space for the trees to expand their crown, so the relation between tree height and crown dimension would be slightly positive.
Improvement
Overall, the relation is weak, because of differences in growth stages and between species. To improve the relationship the correlation graph should be split into relation for each species.
PPT
What is Lidar(Light Detection And Ranging)
- Active remote sensing technique
- optical wavelength analogue of RADAR: NIR/SWIR
- Used for Laser altimetry(height/distance measurement) but also other information
Laser
(Light Amplification by the Stimulated Emission of Radiation)(受激辐射放大光)
Concept of LiDAR
是 Time of Flight
Distance to an object = speed x time Distance = c* t/2
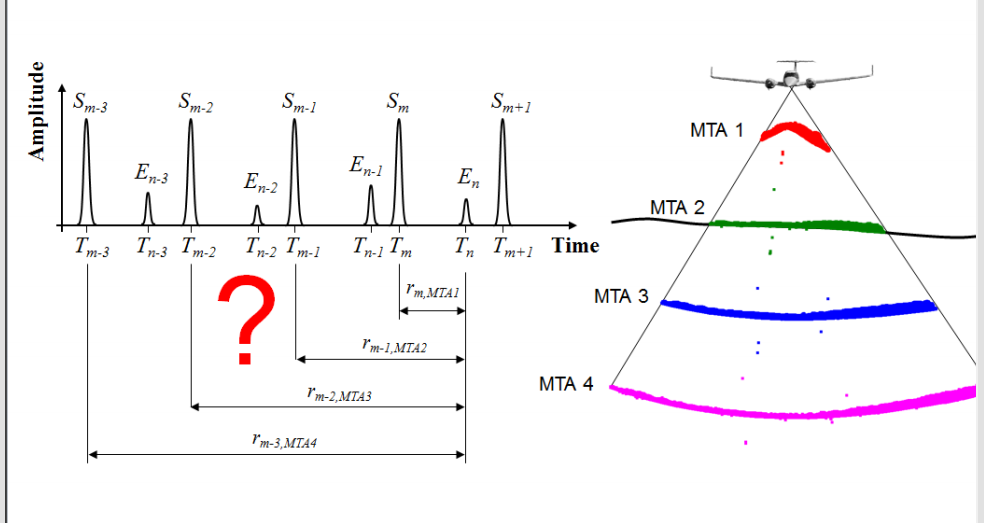
MTA multiple time amplitude(between two Pulse)
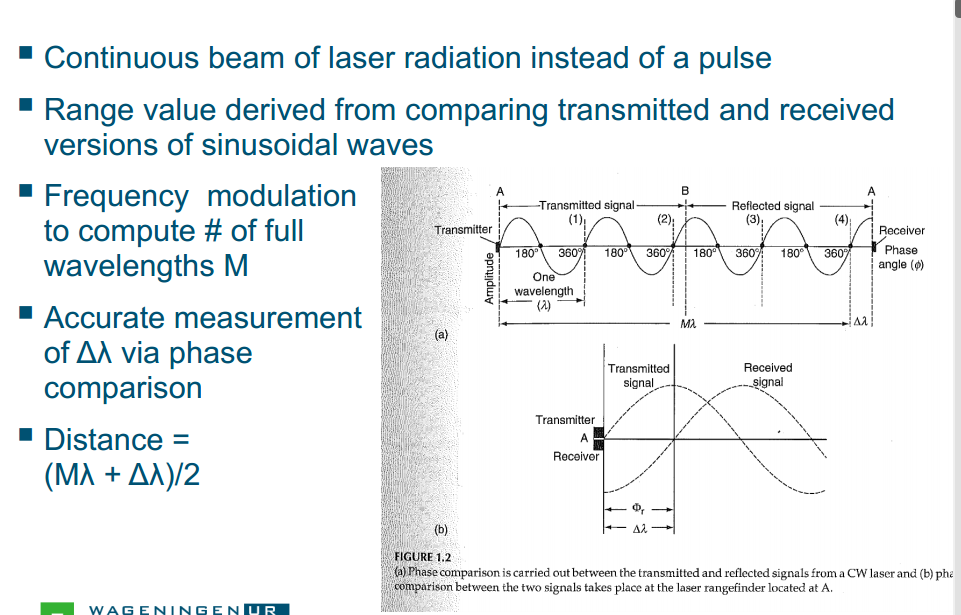
Phase(Continuous beam of laser radiation instead of a pulse)
match the two signals(match the transmitted and received version of sin waves)
Types of LiDAR systems
Different Types of Platform
1. Spaceborne LiDAR
2. Airborne LiDAR -> ALS
3.Terrestrial LiDAR -> TLS(Laser Scanning) and Mobile TLS
Requires precise knowledge of platform location and orientation
- GPS
- INS inertial Navigation System惯性导航系统 Typically mirror scanning
Airborne LiDAR
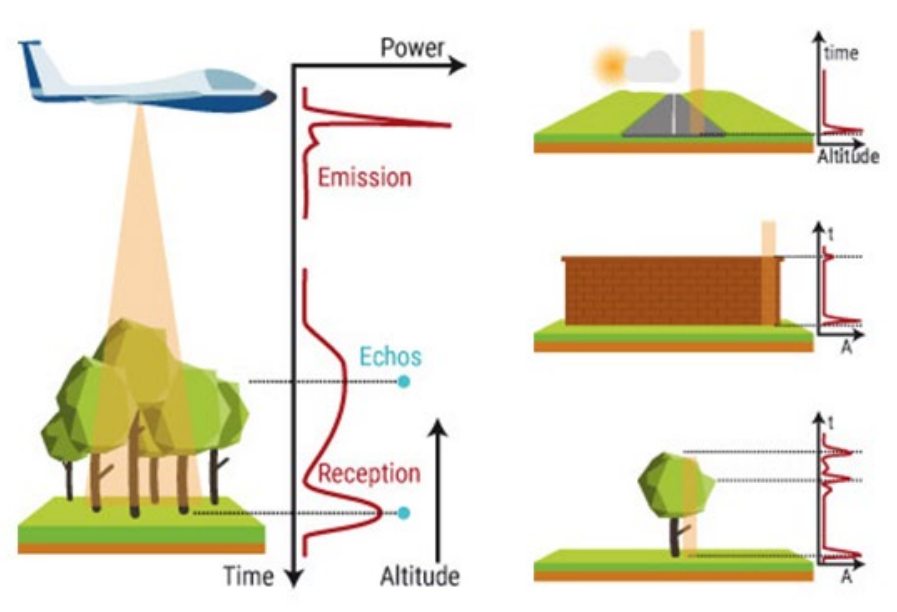 multiple pulse /echos glass double bonce back»> black
GEDI: Now in space
Discrete(single or multiple returns) and waveform
Beam Divergence发散度
等于 rate at which beam is spread Laserbeam disperses when further from emitter激光束离发射器越远越分散
Footprint and pulse spacing
Footprint: the size of the beam on the sampled object Pulse Spacing: the space between pulses on the sampled object 就是这个发散度在采样的对象上投影的Beam的大小是footprint。两个之间的距离是pulse spacing。
Small and large footprint
Small footprint(Terrestrial and Airborne; Discrete and full waveform)
Advantage
● Airborne LiDAR and TLS ● beam has high chance of penetrating holes in canopy»> Good for ground samples ● height measurements more easily associated with a single ‘object’»>Rather than blurred over some area
Disadvantage
● Chance to miss tree tops»> Horizontal sampling is important ● Double count
Large footprint(Air and space; Full Waveform)
● Waveform LiDAR (e.g. GEDI) ● Sample returned energy ● Into equal time (distance) bins
Plot Average Changes with Same Scanner
Forest
- Forest Structural Complexity Tool
- Per Tree: DBH, Height, Taper, Stem volume
- Per plot: Tree, Stem Volume, Mean DBH/Height
LiDAR vs Photogrammetry
Costs, Availability, Large area mapping, Range
Cost:
- LiDAR: Higher sensor costs, expensive data acquisition, and processing.
- Photogrammetry: Generally more cost-effective, especially for smaller projects. Availability:
- LiDAR: Sensors are becoming more affordable and accessible.
- Photogrammetry: Widespread accessibility due to consumer-grade cameras and drones. Large Area Mapping:
- LiDAR: Excels in large-scale mapping, especially in challenging terrains.
- Photogrammetry: Effective for smaller to medium-sized areas, challenges in dense vegetation or steep terrains. Range:
- LiDAR: Longer measurement range, suitable for mapping larger areas from aerial or satellite platforms.
- Photogrammetry: Shorter effective range, accuracy may decrease with distance, impacted by obstacles. Choosing between LiDAR and photogrammetry depends on project requirements, budget, and the characteristics of the mapping area. Often, a combination of both technologies is used for optimal results in various applications.
Applications
Broad Or global estimates
- Mapping global forest canopy height through integration of GEDI and Landsat data
- Carbon stocks
Narrow(to potatoes, apples, and trees)
- Phenotyping individual crops using UAV LiDAR
- Digital Twin: Apple Orchards
Functional Structure Plant(FSP) Models
- the function processes
- 3D structure of a plant
Understanding forest&trees
![[3ea26a733c41c63983b5d11d2621eaa.png]] Increasing AGB uncertainties with larger trees
Measuring trees digitally
Real Tree > Point cloud data > Tree 3D models
tree height, crown diameter, DBH, trunk length, branch diameter and length etc… Tree volume, Tree biomass, Branch angles, Metabolic scaling
QSM Plot scale automated tree extraction
Massive plot pointcloud > individual tree recognition> automated tree modelling
Semi-automatic tree extraction»Plot-level tree reconstruction
In the forests
- Traditional fieldwork Pre-harvest : Diameter at breast height, total height Post-harvest: TLS-derived , crown diameter, aboveground biomass
- TLS scanning
- Tree harvesting
- Reference measurements
Summary
LiDAR是什么
LiDAR is an active remote sensing technique. Measures distances by illuminating the target object with a laser light and detects the reflection of the target. As a sensor, we are able to mount it in different equipment.
应用
Different types of forest and tree parameters are able to be estimated directly from the pointclouds. With the help of algorithms, we are able to estimate indirect parameters. Potential to assist on productivity and ecological dilemmas.
文档信息
- 本文作者:Xinyi He
- 本文链接:https://buliangzhang24.github.io/2024/01/17/Advanced-Earth-Observation-2.LiDAR-Light-Detection-And-Ranging/
- 版权声明:自由转载-非商用-非衍生-保持署名(创意共享3.0许可证)