Exercise
Preprocessing
Creating a raster brick and cleaning the MODIS data using the reliability layer
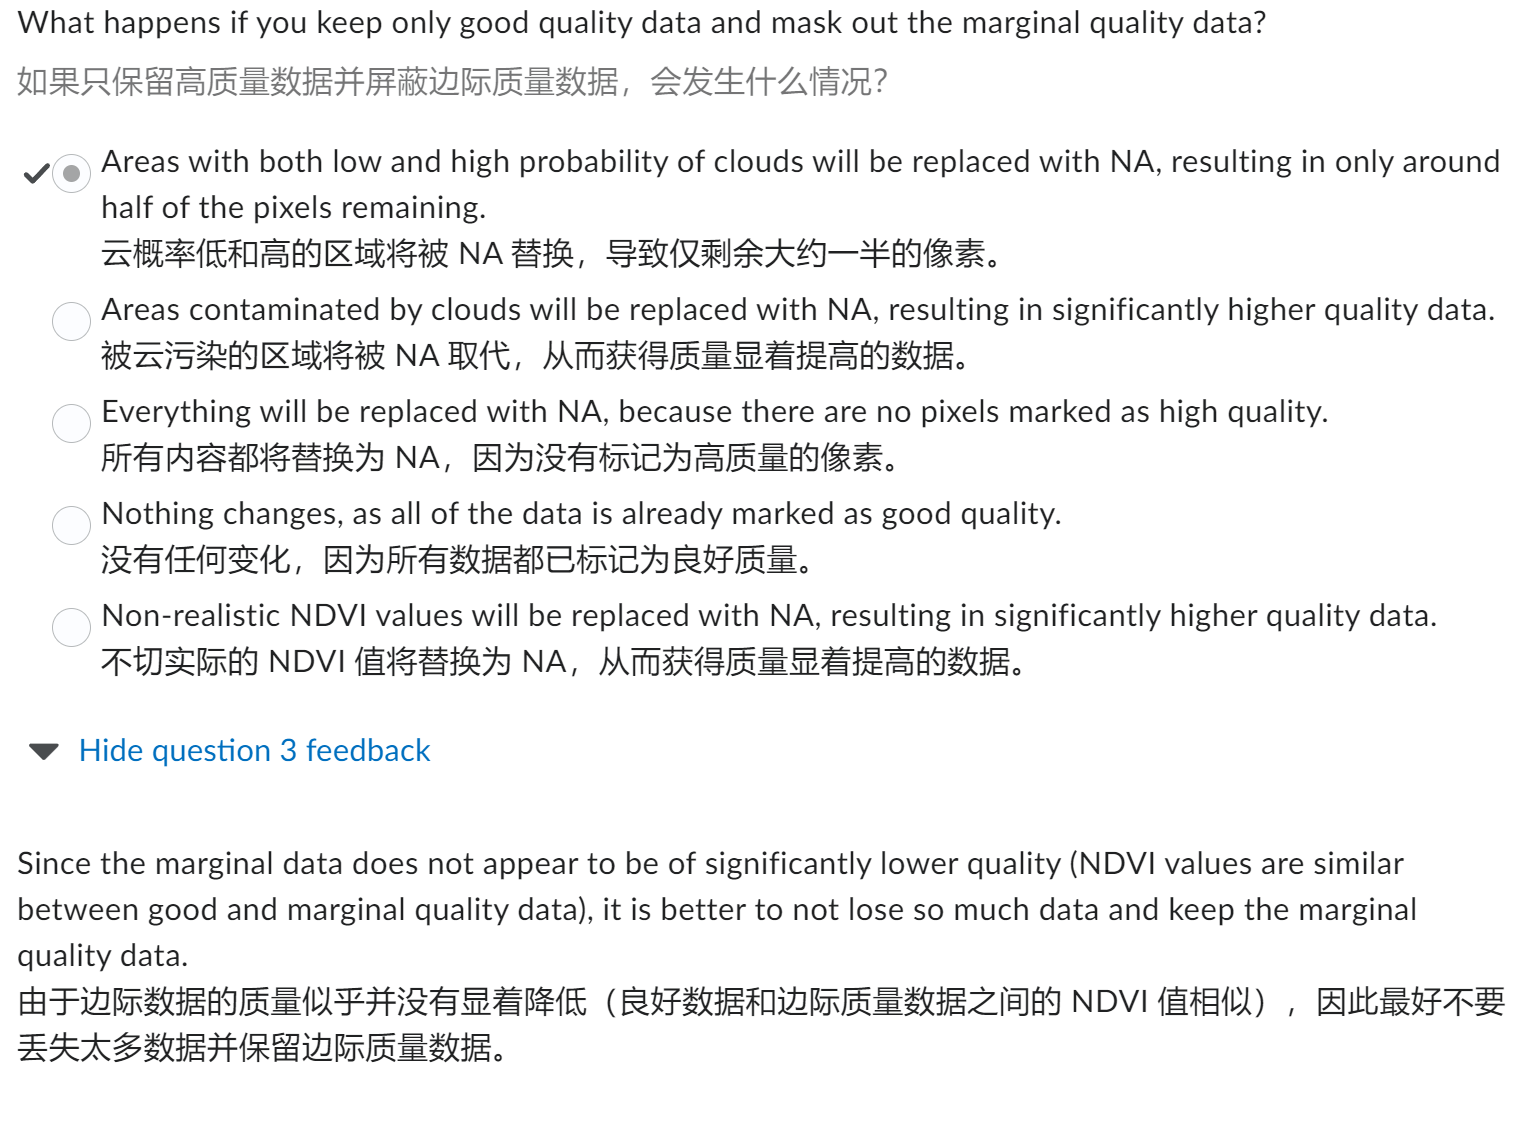
Option 1: detect break at the end of the time series with BFAST Monitor
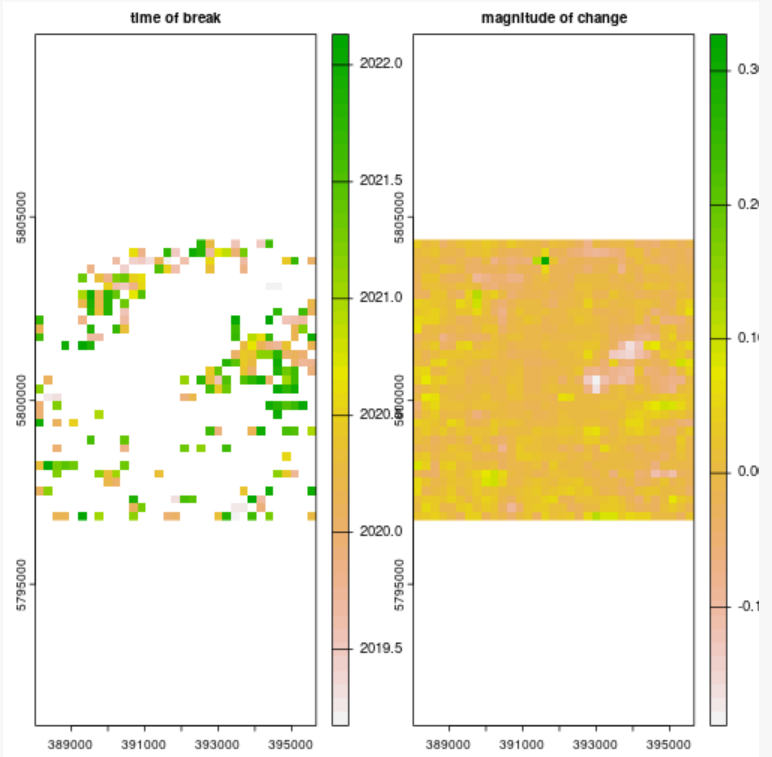
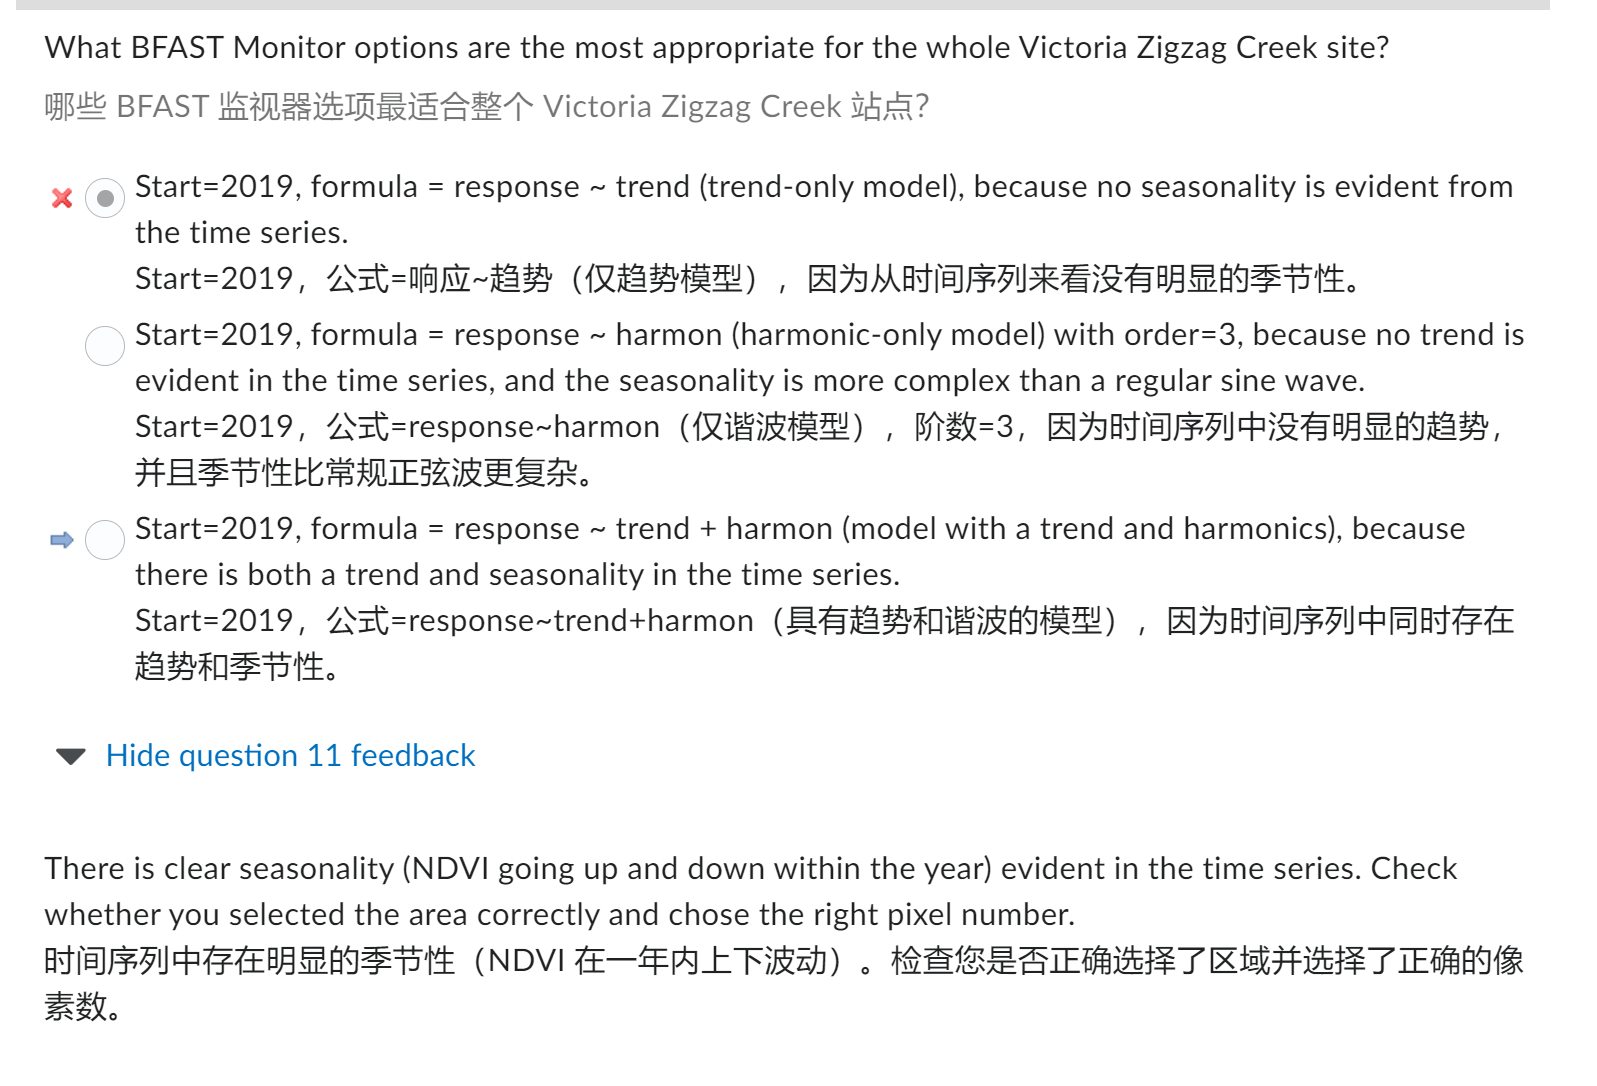
Now we apply the bfastmonitor function using a trend + harmon model with order 3 for the harmonics (i.e. seasonality modelling): ==Time of break== ==Magnitude of change plot== 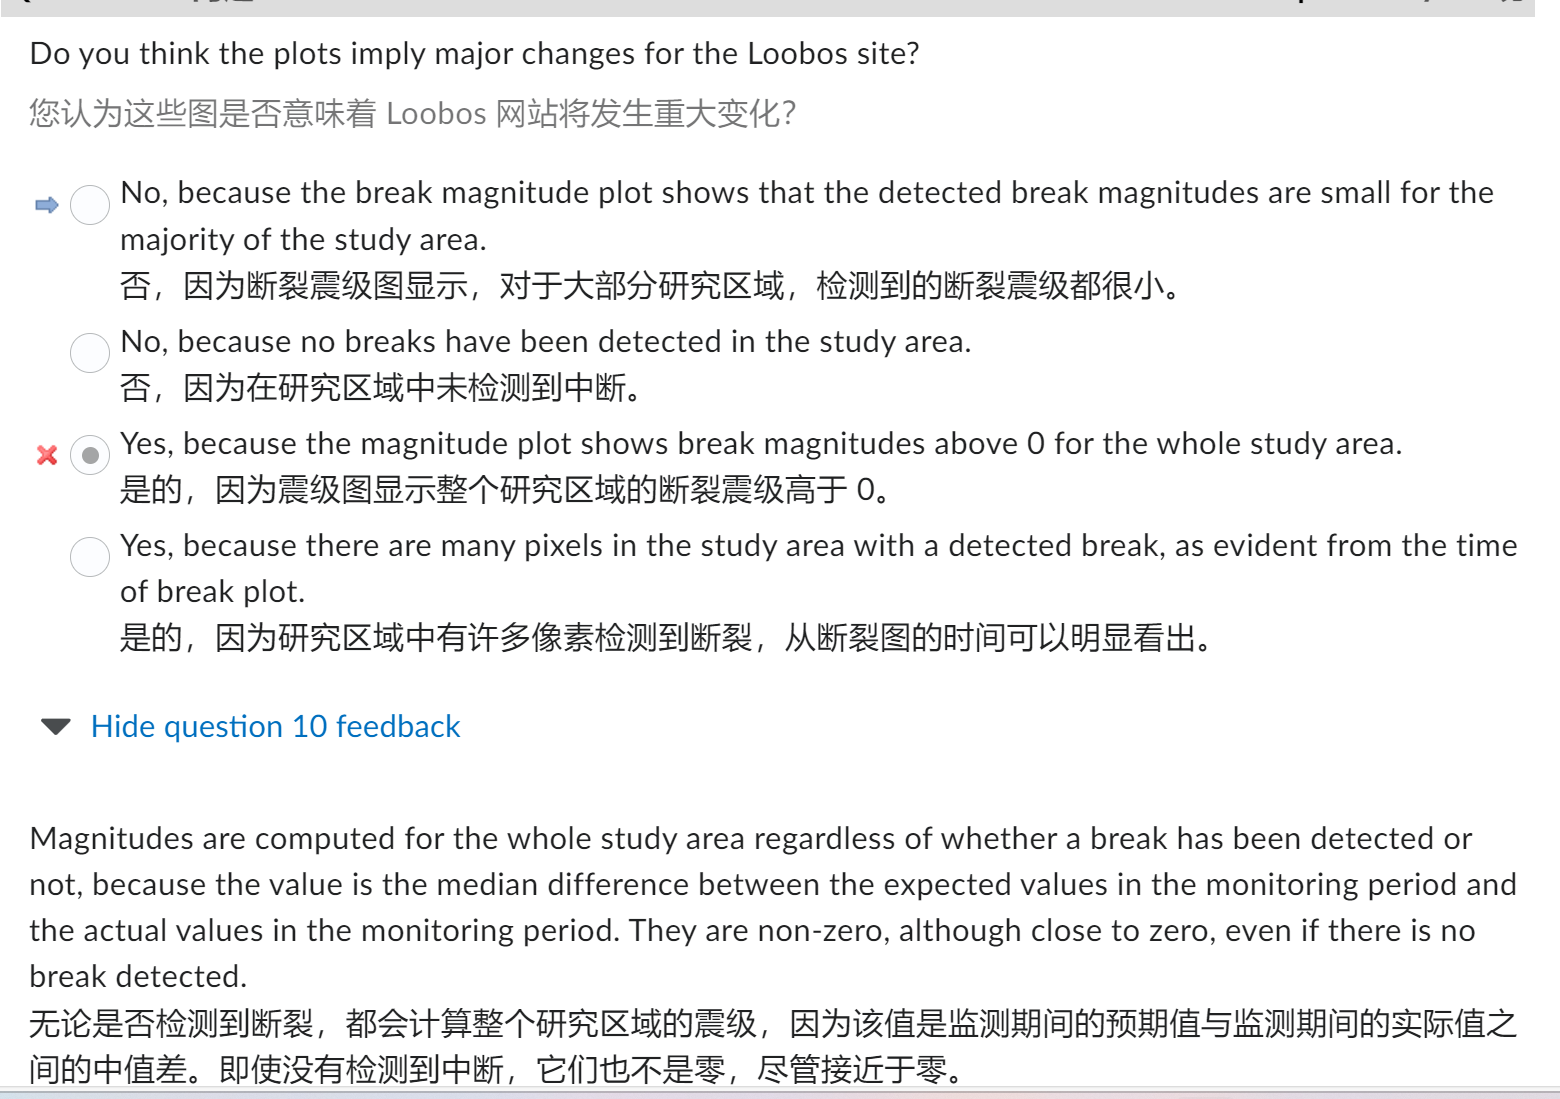
Option 2: detecting all breaks in the middle of a time series with BFAST Lite
BFAST monitor用于检测时间序列末尾的第一个中断。如果您需要检测多个中断,则需要使用不同的算法:BFAST 或 BFAST Lite。 让我们对前面步骤中的数据运行函数 bfastlite() 。与默认值 LWZ 相比,将参数 breaks 设置为 BIC 可以更自由地检测中断。
Seasonality monitoring using harmonics
PPT Part1
引言
Why time series analysis?
- understand ==long-term changes== and ==dynamics==
- ==Near real-time== change detection
Satellite-based time series analysis
Urban Sprawl Sea level rise Annual Forest change» selective logging
研究现状(radar 狠狠增长)
Global dense satellite time series imagery, at 10 – 30m spatial resolution now available openly:
- Optical: Sentinel-2, Landsat,
- Radar: Sentinel-1
Microsatellites provide high resolution (1 – 5 m) data
- Optical: Planet Labs
- Radar: IceEye, Capella Space
Content
Bi-temporal versus time series
two points vs series
Bi-temporal Change Detection
e.g.
- image differencing
- delta classification
Advantage
- conceptually simple and quick
- easy to interpret
Disadvantage
- no accurate timing of changes or understanding of dynamics
- inaccurate estimate of change magnitude Bi-temporal versus time series
(complete)Time Series
Advantage:
- accurate monitoring of forest change dynamics and timing
- analysing change (e.g. change magnitude) and post-change parameters (e.g. recovery speed, follow up land use)
Disadvantage:
- conceptually(概念上) more advance
- mainly pixel-based
Preparing for time series analysis
Important steps: ==1. Image acquisition»2. Pre-processing»3. Analysis==
1.Image acquisition
- Trade-off(权衡) between spatial and temporal resolution
- High spatial and temporal resolution E.g. Sentinel 1/2 sensors; 5 daily, 10-20m Planet: daily, 4 m (PlanetScope) or 5-daily, 1 m (SkySat)
2. Pre-processing(optical satellite data)
目的Maximizing the signal to noise ratio
- Geometric correction
- Radiometric correction
- Atmospheric correction
- Cloud Masking
- Compositing 影像合成
- Derivation of vegetation indices
- Advantage: extract cloud and atmospheric effects
- Derivation of vegetation indices ==Pre-processing advantage with time series»extract cloud and atmospheric effects==
3. Analysis(Time series methods)
Break-detection
BFAST: Breaks for Additive Season and Trend CCDC(Continuous Change Detection and Classification)
Segmentation
LandTrendr
Probabilistic approaches
Bayts
Conclusions
- Derivation of vegetation indices ==Pre-processing advantage with time series»extract cloud and atmospheric effects==
- Time series analysis
- Understand long-term changes and dynamics
- Near real-time change detection
- Selection of time series methods depends on application
- Dense & high resolution Sentinel-1 (radar) and -2 (optical) time series available
PPT Part2
Disturbance monitoring using BFAST-type algorithms扰动监测
BFAST family(Breaks for additive seasonal trend)
- BFAST: find ==all breaks== in the time series
- BFAST Lite: faster, but less detailed version
- BFAST Monitor: find one break ==at the end of the time series==
- BFAST01: find the single ==biggest break== and classify its type
BFAST(Breaks For Additive Seasonal Trend)
find all breaks in the time series
Components of a time series:
- Trend
- Seasonality
- Noise 三个加起来是Time series
BFAST principles
(1).Decomposition 分解
- using stl()
- Season and Trend decomposition using LOESS (locally estimated scatterplot smoothing) into components
(2).On each component
- Piecewise linear regression(线性相关)
- Optimise to minimise model’s residual sum of squares (RSS)(最小残差和)
- Choose number of breaks based on Bayesian Information Criterion (BIC)(break的次数)»>BIC越小,表示模型在拟合数据上的表现越好。在时间序列分析中,如果考虑断点的个数,可以尝试不同的断点数量,计算每个数量下的BIC值,然后选择BIC值最小的数量作为最优的断点数量。
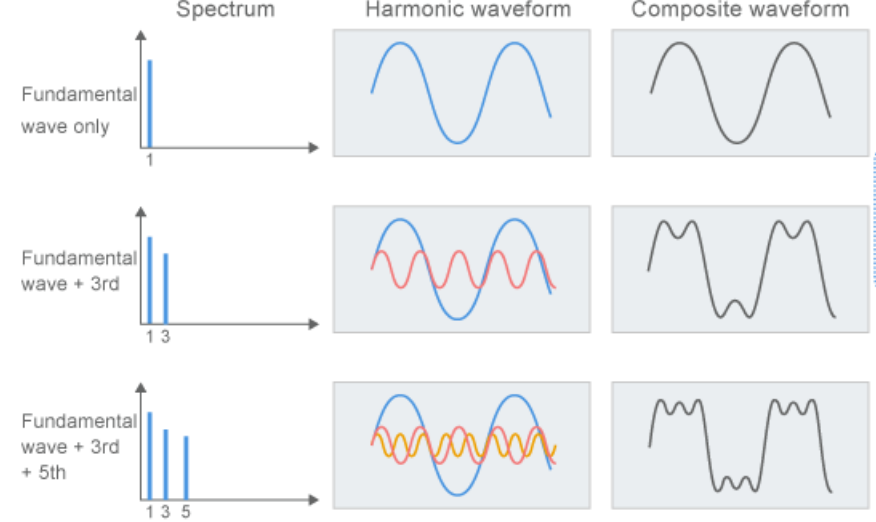
Linear regression of seasonality: harmonics
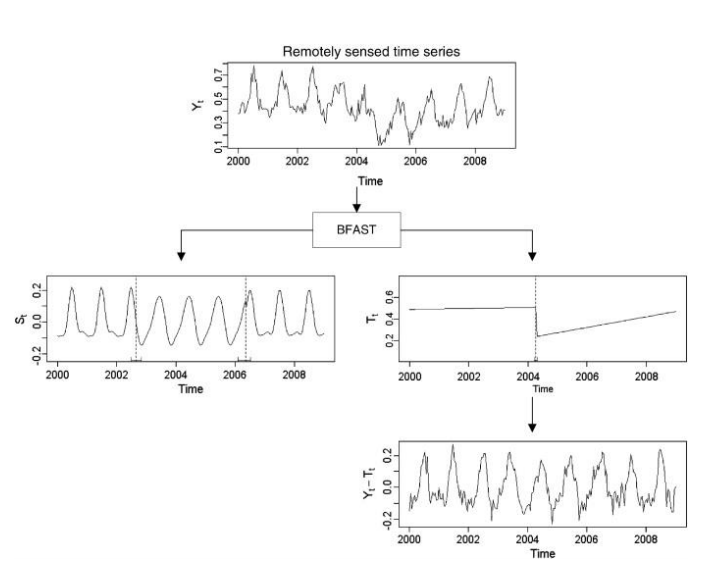 This gives all breaks in the time series, separately for season and trend
BFAST Lite
==updating historical land cover maps globally==
- Concept: faster, but less detailed version»> new development, like BFAST, but skips (1) and goes straight into (2)
- Advantage
- significantly faster
- handles missing values
- Does not distinguish between breaks
BFAST Monitor
- Near real-time change monitoring
- The end of time series abnormal or not==(deforest)==
- Temporal perspective»>Using the history to determine what is normal
- Methodology: 3 steps for near real-time monitoring
- Identify a stable history period
- Model the stable history period
- Do new observations in the monitoring period conform with the expected behaviour of the history sample
BFAST01
find the single biggest break and classify its type
文档信息
- 本文作者:Xinyi He
- 本文链接:https://buliangzhang24.github.io/2024/01/21/Advanced-Earth-Observation-6.Time-series-analysis/
- 版权声明:自由转载-非商用-非衍生-保持署名(创意共享3.0许可证)
