
Exercise
geolocated coherence backscatter images analyze and interpret the imagery.
SNAP
Preparation
Coherence Estimation
First, we will co-register the input images so that their pixels match and interferometry can be performed. Then, we will calculate the coherence, merge the bursts of the images, and geocode the product.
Backscatter Estimation
Pixel Spacing
(是single-look slant range and azimuth resolutions)
- 𝛿𝑔𝑟 = 𝛿𝑠𝑟 / sin 查资料的已知S1 SLC data的slant range= 2.7m, azimuth resolution = 22.5m 又已知最终的地理编码相干和后向散射产品的像素间距(pixel spacing)为20米 又假设incidence angle 是34 degree
求当window size是5乘1(range乘azimuth)的时候,ground range resolution 和azimuth resolution是多少?
34 degree 是0.55 radians sin0.55 radians是0.55 so ground range resolution是4.83 4.83乘5= 24.15是 ground range resolution when window size(range)=5 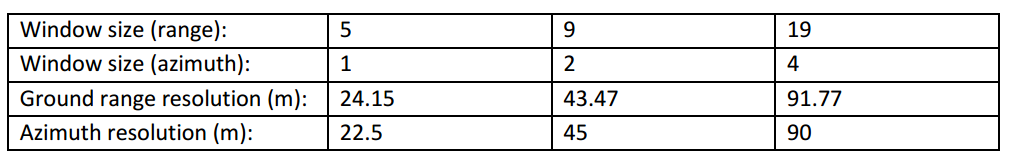
为什么比例是5
(The ratio between the range and azimuth window sizes is approximately 5 for all multilooking and coherence estimation windows used in this exercise) 为了正方形 Each window should have the same ratio in order to keep the azimuth and range resolution the same, to keep the similar shape of the samples, resembling a square of a pixel.
Small Window
What type of systematic effect can you observe
==For smaller window, thus for fewer samples, the estimator would be biased, overestimating the coherence==
Why is the coherence image calculated with the smaller coherence window “==whiter==” than the other coherence image, calculated with the larger coherence window?
Smaller coherence window overestimates the coherence between the images. Greater values would show as brighter on the image.
Coherence and Backscatter Analysis
==高相干值是相似,是亮==
Why is the 12-day coherence of intact forest lower than that of the burnt forest?完整森林和烧了的森林在coherence
Intact forest with green leaves would have lower coherence values because of the moisture differences and movement of the leaves in the wind. Whereas burnt forest would have less variation in condition.
Why can you not distinguish the burnt area in the 12-day coherence image from 2022?
The image in 2014 was acquired couple of months after the fire, leaving the area bared, with little change in 12-day time period. This is represented by high coherence values. After 8 years, in 2022, the vegetation started to ==regrow== on those patches. Thus, in 2022 this area is becoming again a low coherence object. The regrowing forest has a lot more movement (leaves and branches are reacting to wind than a burnt forest patch.
Why do urban areas typically show high coherence values, both in the 12-day coherence images and in the 8-year coherence images, while agricultural fields only show a relatively high 12-day coherence, while the 8-year coherence is low?城市和农田对比
Urban areas will have higher coherence values independent of the time period interval, because the built-up conditions do not vary visibly.
Whereas agricultural fields, when the crops are growing, won’t change in appearance by much within 12-days, compared to changes across several growth cycles, irrigation practices and the types of crops that are cultivated in 8-year interval.
Considering the data from Table I, what is a plausible explanation for the backscatter image from 2022 to be “whiter” than the image from 2014? Explain your reasoning!温度对backscatter的影响
For 2014, the temperature was below 0 (-8.9 degrees Celsius) which means freezing condition. The icy surfaces have lower dialectic properties, resulting in lower backscatter. The dialectic constant shows a drop under the freezing conditions.
Whereas in 2022 the temperature was higher than 0(4.1 degrees Celsius), resulting in higher backscatter. 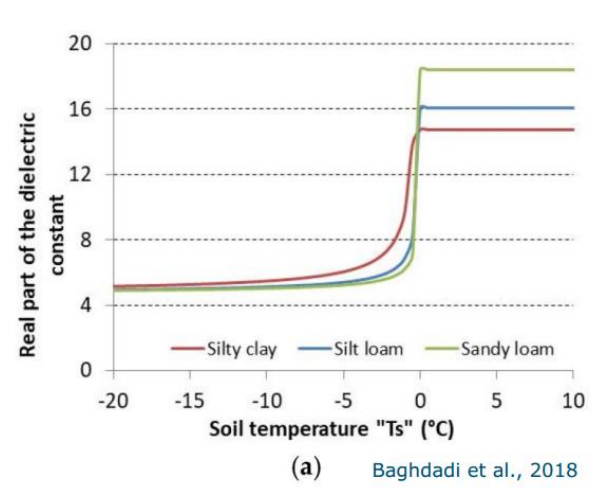
PPT
What ?: mass of living and dead organic matter
- Essential Climate Variable
- 50% of dry biomass is carbon
In forests 是各种东西的总和
stem volume, growing stock volume
Where need?
Climate modelling: forest biomass map » carbon budget» climate model
Where stored?: Above-ground forest biomass(AGB)
(因为大部分biomass都store在above-ground forest) ==Most important component== of the terrestrial biomass
- Common unit: tonnes per hectare (t/ha; or Mg/ha)
- ==Measured== only through destructive inventories毁了才能测量!logging,dry and weighing 所以需要估算:==Estimation== methods:
- Non-destructive inventories (with formulas)→ Accurate but no maps
- Near-sensing (e.g. TLS, drones)→ Quite accurate but only local maps
- Remote sensing (aircraft & satellites)→ Large-scale maps, but less accurate
Global forest types
- Boreal forests» Low AGB density
- Temperate forests»Medium AGB density
- Subtropical & tropical forests»High AGB density
- Savannas» Very low AGB density
- Mangroves» High AGB density ground inventory density » latitude 0 » almost 0 » inassessable
Radar for AGB mapping(biomass)
Advantages
- cloud canopy-penetrating
- sensitive to AGB (within limits)
- coherent techniques: interferometry干涉
Challenges
- Big & expensive systems
- complex processing
- non-intuitive非直觉的 and ambiguous image interpretation
AGB estimation from SAR
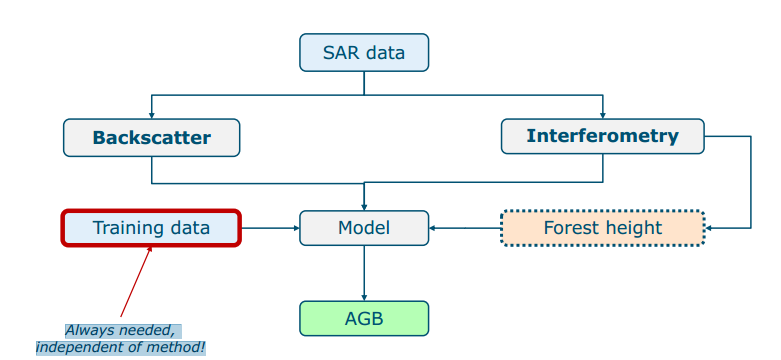
- Reference AGB data are essential for AGB estimation (参考AGB数据对于AGB估计是必不可少的)
- 两种方式去explore AGB data 就是Backscatter 和interferometry
- More accurate monitoring is needed, especially in the tropics, for a long list of applications
Fundamentals of radar-based AGB estimation
Backscatter depends on:
- Size relative wavelength
- Moisture content & material
- Shape & orientation
- Surface roughness relative wavelength
Polarimetry helps understand target geometry:
- 横的电线杆子visuable in HH ,not VV
Main scattering mechanisms:
- Volume scattering (from the canopy)
- Direct scattering from ground and trunk
- Double-bounce scattering (e.g., ground & trunk)
Absolute & relative contributions depend on:
- size, structure & roughness (tree, ground)
- moisture content (tree, ground)
- wavelength
- Polarisation, incidence angle
==Longer waves → better sensitivity to AGB== 所以其实VHF是最好的
AGB & SAR backscatter
Airborne only
- VHF-band»1000-100» expect trunk, all is too small to be seen Mostly ground-trunk Strong dependence on Polarisation and Topography
Airborne & spaceborne use
- P-band» 100-50»trunk Main mechanisms: Ground-trunk, ground, canopy Strong dependence on: Topography, soil & canopy moisture, vegetation structure»These effects decrease AGB estimation performance No P-band satellite data available» ESA BIOMASS(2024)
- L-band» 30-15cm»L band will lose more double bonce (less trunk) C-band» 7.5-3.8»C band season, but biomass dominated by carbon X-band» 3.8-2.5 对AGB的敏感度(sensitivity)减少with AGB上升和frequency 上升 Saturation level depends on: 这三个对Biomass估算的饱和度 Wavelength (band), Length of time series, Applied pre processing (e.g., ground backscatter removal), Weather & site properties (topography, moisture, …)
double bonce and direct Hilly test site »inassess Flat test site» moisture//sensitivity
Summary
- 在解译SAR图像的时候,考虑四个因素: frequency, polarisation, scattering mechanisms
- VHF-band 在AGB estimation 分析中是最好的,但是因为电离层所以不能space
- P-band 在Global 的AGB estimation 中是最有潜力的(especially HV)
- L-, C-, and X-bands have lower sensitivity to AGB, albeit long time series & adequate pre-processing can improve AGB mapping results
Interferometric Radar for AGB monitoring
InSAR干涉的side-looking airborne radar
- 测量的是 amplitude and phase
- 为什么phase是随机的:speckle and noise»speckle is reproduceable , so it is not noise
- 什么时候两个SAR图像的Phase data 是相关的? speckle is stable 和 imaging geometry is similar
- SAR interferometry can give cm-scale differences of Earth’s surface from space Interferometric SAR (InSAR) exploits ==phase== difference between two SAR images
Interferometric modes
Depending on temporal and spatial baselines, phase can contain information about ==target elevation or velocity/displacement==
by spatial baseline B
- Across-track interferometry 两个sensors, 然后spatial offset B != 0(夹角非常小), 其中 Phase difference是elevation
- Along-track interferometry 一个sensor, B约等于0,temporal offset != 0, phase difference是line-of-sight displacement or velocity (𝑣)(位移和速度)
by temporal baseline t
- Repeat-pass interferometry» Sentinel-1 上面两个都有,BIOMASS Acquisitions with time delay延迟 Easy to implement (one satellite sufficient)好实现 Long temporal baseline means that elevation & velocity can only be mapped in temporally stable environments只能在平的表面
- Single-pass interferometry » SRTM(shuttle radar topography mission)只有aross-track, TanDEM-X simultaneous acquisitions不延迟 Requires at least two satellites/antennas → costly to implement贵 Negligible temporal baseline allows mapping of elevation & velocity in fast changing environments不挑表面 6 days / 12 days » they come back to same position
InSAR processing
- Co-registration: sub-pixel interpolation of complex images in radar geometry(亚像素插值)
- Interferometric processing: estimation of coherence magnitude and phase
- Geolocation: interpolation to map geometry几何插值
Complex coherence复数相干性
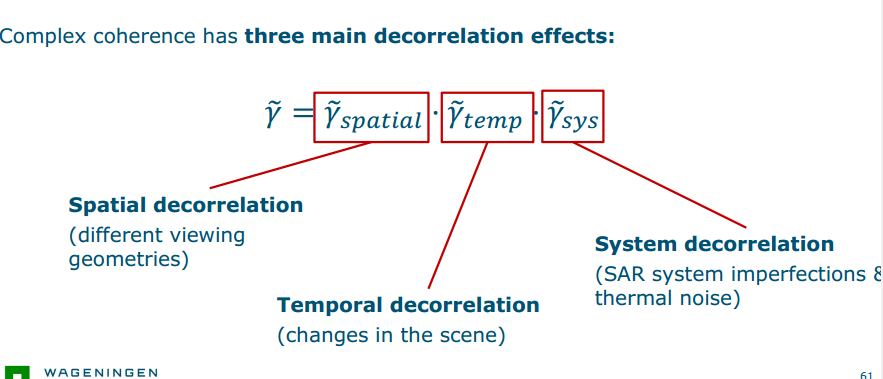
Three main decorrelation effects
- Spatial decorrelation(different viewing geometries)
- System decorrelation(SAR system imperfections & thermal noise)
- Temporal decorrelation(changes in the scene)
分析
- Along-track interferometry 时,Spatial decorrelation约等于1
- Single-pass interferometry时,temporal decorrelation是1
- 减少system decorrelation: adequate system design, low-noise amplifiers, adequate target selection
complex coherence has a magnitude and a phase» ==0 = no similarity, 1 = identical images==
Coherence magnitude 一致性程度: bias
Biased estimator → overestimation(高估) for low 𝑛 and/or low-coherence targets
- Tree : low coherence due to temporal change(wind, rain) over 12 days
- Person: low coherence due to movement over 12 days
- Buildings: high coherence
Interferometric phase解决bias的一种方法
是Average phase difference between images 优点unbiased 但是 standard deviation取决于target coherence, 2pi ambiguities
interferometric phase components
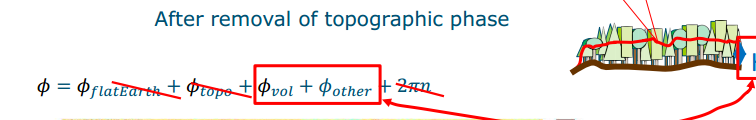
- Flat Earth phase(可消除): incidence angle variability from near- to far-range近端远端
- Topographic phase: Terrain elevation above “flat Earth” model 凹凸不平
- Contribution of volume scattering: Volume scattering above terrain 树
- Phase due to temporal change: change of terrain height or change of volume
- 2Pin(可消除)
Forest height can be estimated with various methods/datasets; can provide AGB
estimates in certain conditions (homogeneous forests)
Phase height
Phase height = DEM – DTM ∝ 𝜙𝑣𝑜𝑙 + 𝜙𝑜𝑡ℎ𝑒𝑟 Phase height ≈ Forest height???
Forest height
- from X-&P-band DEM difference: 有关系,但穿透偏差大,性能不稳定
- from low-frequency PolInSAR Steps: 1. Study coherence & DEM at different polarisations 2. Use a model to describe that variability 3. Fit the model to data to estimate height 特点: 1. 适合P 和L band (repeat-pass) 2.在Boreal forests and dense tropical forest 表现好 3. BIOMASS P-band 有用在near-global forest height
AGB from forest height
- single tree : species-specific model, tree height and stem diameter
- AGB from forest height only: ==✓ Homogeneous forest==, few species × Heterogeneous forest, many species
==InSAR coherence can be used for AGB estimation, change detection, classification.==
Stem volume from C-band coherence
- ESA ERS-1 (1991-2000) & ERS-2 (1992-2011) C-band SARs
- Several temporal baselines: 1 day, 3 ⋅ 𝑛 days
- Boreal forests (Sweden, Finland) & stable conditions: ● Stem volume estimated fromcoherence
AGB from C-band coherence
- Copernicus Sentinel-1a (‘14-), Sentinel-1b (‘16-‘21), Sentinel-1c (‘23?-) C-band SARs
- Temporal baselines: 6 ⋅ 𝑛 days (2 satellites) and 12 ⋅ 𝑛days (1 satellite)
- Semi-arid forests (California) & stable conditions: ● AGB estimated from coherence
Land cover (change) from C-band coherence
Temporal decorrelation across land covers:
- Urban: high coherence
- Forest: low coherence
- Water: very low coherence
- Cropland: depends on season, use intensity, Many applications to land cover mapping and monitoring Jacob et al., 2020
bigger windows » less biase» dis(sys effect) what is windows» number of pixels(?) X band phase height» more use
文档信息
- 本文作者:Xinyi He
- 本文链接:https://buliangzhang24.github.io/2024/01/23/Advanced-Earth-Observation-8.Biomass-monitoring-with-satellite-radar/
- 版权声明:自由转载-非商用-非衍生-保持署名(创意共享3.0许可证)