
Exercise
基于分层抽样的估计地图精度,估计面积和置信区间
1. Accuracy estimation based on sample counting
根据样本计数计算简单的混淆矩阵和准确性估计。如果使用简单随机抽样,基于该方法的地图精度计算是正确的。换句话说,所有样本单元被纳入样本的概率相同
2. Area weighted accuracy estimation for stratified sampling
Why is converting the map to an equal area projection a necessary step?等积投影
An accuracy assessment which includes area weights and inclusion probabilities based on the size of the surface, would be more accurate if the area size is preserved.
The sample inclusion probability refers to the probability that a sample pixels is selected. Inverse of the inclusion probability (i.e sample weights) is used for area weighted accuracy estimation.样本包含概率是指样本像素被选择的概率。包含概率的倒数(即样本权重)用于面积加权精度估计。
这个面积加权之后的变化,为啥变化?
- Overall accuracy 增加 The overall accuracy of the area weighted increases, because the incorrectly classified pixels in the smaller areas (like class 7) have a lower weight/less influence on the overall accuracy.
- 用户精度不变,生产者精度变化The user accuracy calculates inside one class, but the producer’s accuracy calculates among the different classes (both TP and FN). After changing the projection, and including an area weight, the area of different classes is corrected in different levels/proportions, so the producer’s accuracy will change.
3. Area estimation accounting for map errors
改正后的区域面积和基于地图估计的区域面积之间比较
The error adjusted includes the pixels which were missed (False Negatives) in the area estimation. If the difference is larger, it means that the denominator of producer’s accuracy (TP + FN) was smaller, so there were fewer false negatives.
4. Automated calculation of accuracy and confidence intervals
根据误差调整面积估计和置信区间,哪些类在面积估计中具有最高的不确定性?
Considering that the first shows the error adjusted estimated area and the second row is the + or –uncertainty range of the area size, the area that could possibly either be or not be in the estimated area size.
5. Sampling designs and sample allocation
当需要验证图谱时,可以使用不同的抽样设计选项来选择验证样本 When focusing on class area estimation, which sampling options is preferred? (当关注类面积估计时,首选哪种采样选项?考虑样本包含概率和每种湿地类型样本点的代表性) 选sample sites per class types. As we saw with the random sampling, the area size of the classes in the field needs to be accounted for to ensure more accurate classification. Comparing them proportional and custom sample size approach, the custom sample includes the pixels for each class.
- Sample inclusion probability: Inclusion probability for classes with smaller area is in this case really low. By manually thresholding the number of pixels for each class the probability of smaller classes to be selected is greater.
- Sample sites per class types: In the proportional sampling option class 9 has 0 pixels selected, and few for classes 2, 3, 6 and 7. As the proportion was based on the area size of the classes, smaller classes did not get enough samples for statistical analysis. With custom sample sizes, the sampling resulted in more samples per class, however, smaller classes are still underrepresented.
PPT
Research purpose:
creating ==maps== and drawing conclusions 画地图 OR testing and comparing ==models==建模型
Why map accuracy assessment?
- remote sensing 的优点: it often allows wall-to-wall coverage of the area under consideration for a measurement variable.
- remote sensing 的缺点: The weakness of remote sensing is that results are never perfect.
Map accuracy assessment is an integral part of remote sensing based monitoring which informs on the map quality.
- positional accuracy: determines how closely the position of discrete objects shown on a rectified image (map) or in a spatial database agree with the true position on the ground.在地图上和在真实位置的区别
- thematic accuracy: refers to the non-positional characteristic of a spatial data entity, the so-called attributes属性特征精确度,属性都错了 Positional error 太多就会从1变成2(Positional error can manifest in thematic errors due to positional inaccuracy. )
How to assess map accuracy
validation是: The process of assessing, by independent means, the quality of the data products derived from the system outputs.
步骤
- high quality in-situ or other reference data
- Representative sample
- More than 30 sample locations
- Update map accuracy assessment if there are new updates.
How to assess map accuracy using representative sample?
- Sampling design如何选择有代表性的样本?
- Response design如何收集地面真相/参考数据?
- Accuracy estimation如何估计精度?
Sampling designs:
- 为了获得unbiased(representative) estimate 无偏估计,我们用probability sampling or random sampling概率抽样和随机抽样
- 概率抽样又叫 inclusion probability :means each sample unit within the area of interest needs to have a probability to be included as a sample unit.
- known and should be non-zero(如果是未知的概率,就是non-probability sampling)
- We cannot say the accuracy number represents the entire mapped area Probability sampling(inclusion probability)»> known»non-zero
四种随机抽样方法sampling selection scheme:
- 简单simple random: Sample sites are randomly selected.
- (different classes)分层stratified random: The study area is divided into strata: Sample sites are randomly selected in each stratum
- 系统systematic: Selecting sample sites based on a fixed distance or interval. Usually, the starting selection is random
- 块cluster random(all pixels in the block):Larger blocks are selected randomly and all units within the block is used.
Which sampling selection scheme to choose?
depends on the objective and requirement
- 成本If fieldwork is required, the cost aspect is important (cluster and stratified).
- 特定阶层用分层Targeting specific classes or regions, stratification can be used.
How many sample size?
- Practical consideration (budget and time)
- Statistical consideration: population proportion/population mean
Response design
- 指的是如何收集ground truth/reference data
- High quality remote sensing images can sometimes used for reference data collection.高质量的图像做收集参考
- Visual interpretation of different data sources is used to identify the reference label at the sampled locations. 使用不同数据源的可视化解释来识别采样位置的参考标签。 - Clear protocol on what to measure (soil ph, carbon or soil type, land use type) - Good preparation and planning
Data sources for collecting the reference/validation data
- Available VHR images (Google, Bing map, and Planet)
- Temporal profiles of NDVI or other indices (Google Earth Engine)
- Multidate images for different seasons (Google earth, Sentinel and Landsat images.
- Geotagged photos or street view (Google earth)
Reference data quality
- Reference labels need to be of high quality and represent “truth” (close representation).
- Visual interpretation is not error-free.
Accuracy estimation
Accuracy metrics
- Discrete (land use type, forest type, forest change) Overall accuracy总体精度 Class accuracy (user’s and producer’s accuracy, F score)类精度
- Continuous variables (biomass, soil organic carbon) Root mean square error (how much the map prediction deviates from the sample)(RMSE) Mean absolute error(MAE) Mean error (ME)
Discrete
Confusion Matrix(all inclusion probability)
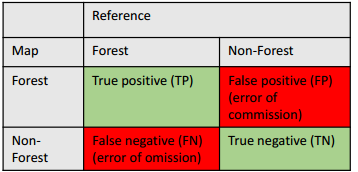
Overall accuracy= TP+TN/(TP+TN+FP+FN) User’s accuracy= TP/(TP+FP) Producer’s accuracy= TP/(TP+FN)
Producer’s and user’s accuracy are calculated for each class. 有效的条件:This works when all sample points have the same inclusion probability 所以,要是不相等呢
What if the sample inclusion probability is not equal?
(就是分层了Sampling weight (inverse of inclusion probability) is different per sample point.) Create a confusion matrix accounting for the sample/strata weights.但是算法还是一样的
Accuracy estimation variance
- The reference sample is selected randomly. 我们用同样的方法抽样得到的精度数字不同?
Because we used a small set of sample, the result might deviate from the population estimation (accuracy of the entire map). 我们只用了一小部分
- We can calculate this uncertainty as confidence intervals for the estimated accuracy.(置信区间)
- The larger the sample size, the smaller the sampling error will be, and the more representative the sample will be of the population.(越大越精确)
- Exact calculation depends on the sampling design we selected, check good practice documents.
0.95+- 0.02 is standard deviation/ confidence interval for specific region of confidence
Machine learning terms for accuracy
Precision = User’s accuracy Recall = Producer’s accuracy
- F1 Score is the Harmonic Mean between precision and recall. The range for F1 Score is [0, 1]. » F1= 2*1/1/precision+1/recall
Continuous variables(biomass, soil organic carbon)
RMSE: Root mean square error (how much the map prediction deviates from the sample) MAE: Mean absolute error –an average absolute difference ME: Mean error – the average difference
Other ways for map assessment
Model-based map assessment using spatially predictive models.
- Not restricted by random sampling.
- Analyze spatial correlation for each class
Model Validation
Why model assessment
Research Objective:
- Developing /improving models (classification, regression)
- Comparing models (classification, regression)
Assessment objective
- How good is my model for unseen data points/locations?
- How good is the prediction?
Response design and accuracy estimation protocols are ==similar== to map accuracy assessment
这个步骤如下,跟地图验证是一样的
- Collecting reference data
- Calculating accuracy/quality metrics
Sampling design
- Sample-based inference is not necessary, although map assessment can also show how good your model is.
- How good is your model prediction at unseen data/location?
Model assessment sample模型评估样本
Depends on the availability of reference data. Sometimes we are not blessed to have a good and large reference dataset.
Order of preference to use:
- Independently collected reference data
- If a large sample set (divide your reference data into training and validation sets)
- If a small dataset, k-fold cross-validation is an option
- If a small dataset, leave-one-out ==cross-validation== (least reliable)
Cross Validation
A statistical method of evaluating and comparing learning algorithms by dividing data into two segments:
- learn or train a model
- validate the model. 验证次数:5-fold validation, 10-fold validation is also common.
- Accuracy is calculated for each iteration on the validation set. 迭代计算
- Average of the accuracy metrics is reported together with a variance.平均值和方差
When sub setting your data into two sets
就是不要在同一个多边形里面划分training pixel 和validation pixel,最好分成两个多边形。
文档信息
- 本文作者:Xinyi He
- 本文链接:https://buliangzhang24.github.io/2024/01/24/Advanced-Earth-Observation-9.Accuracy-Assessment/
- 版权声明:自由转载-非商用-非衍生-保持署名(创意共享3.0许可证)