used for classification
Motivation
- linear regression
- quantitative vs. qualitative(categorical) data quantitative data > regression quantitative Y qualitative data> classification qualitative Y class and regression can be used together
Why not linear regression
- in case of variable Y with >2 categories: Coding categories as numbers (ordering and distance between categories) is arbitrary
- In case of variable Y with 2 categories: Coding with 0/1 would work
- Even with 2 categories there is an issue: Example: credit card default / not default 但是还是不好predict probability
The Logistic Model
main idea: predict probability P(Y=1| X=..)
Logistic function
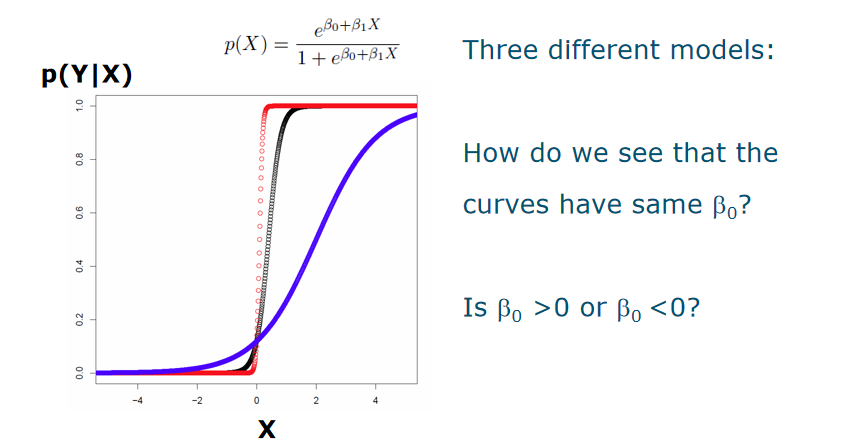
- S-shaped curve between 0 and 1:
 这里Linear regression 范围会小于0,但是它的意义是概率
 - How do we see that the curves have same B0? They cross the x= 0 at same point
- Is B0 >0 or B0 <0? if at the mentioned point the Y value is smaller than 0.5 , the B0<0
 temperature of meidian low and high
Odds
The ratio of the probability of one event to that of an alternative event

Logistic function leads to logit that is linear in X
Logit = log(Odds)
 B1 in linear regression: gives average change of Y associated with one-unit increase in X B1 in logistic regression: gives average change of log odds (logit) with one-unit increase in X
Exercise 9 (a)on average, what fraction of people with an odds of 0.37 of defaulting on their credit card payment will in fact default? (b)suppose that an individual has a 16% chance of defaulting on her credit card payment.What are the odds that she will default? 1 is default,越小越不default 0.37= x/1-x x= 0.16/1-0.16
Multiple Logistic Regression
how can we set decision boundary?this line will be 0.5?
Qualitative predictors
- 用dummies Number of dummy variables one lower than number of levels the variable has??????
Parameter Estimation
Maximum likelihood:
定义:
- maximum likelihood: general approach to estimate model parameters用于估计参数的值,使得给定参数下数据观测到的概率(即似然函数)最大化
- Basic idea: the experimental observations are those that are likely to be observed
- Hence: find values for parameters such that the ==probability of the observed data is as large as possible==
- Likelihood: probability of the data given the parameters
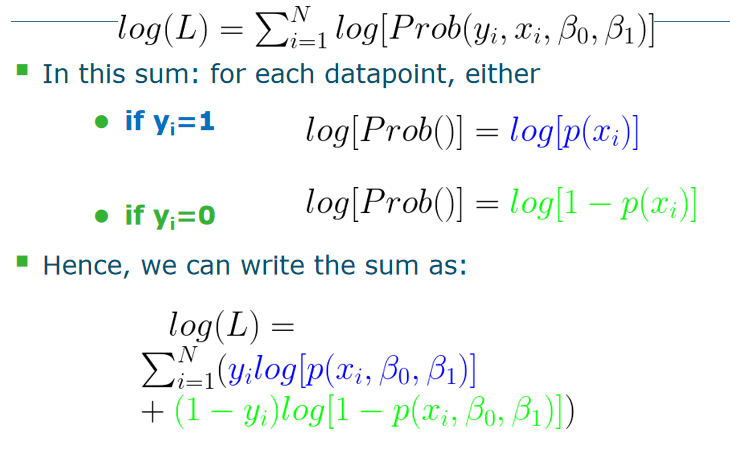
- Define Likelihood L (for N datapoints) L=![[Pasted image 20240214112727.png]] The assumption of L : independent Optimal parameters given data: those that maximize L BUT,Instead of maximizing L, maximize log(L)
推导:


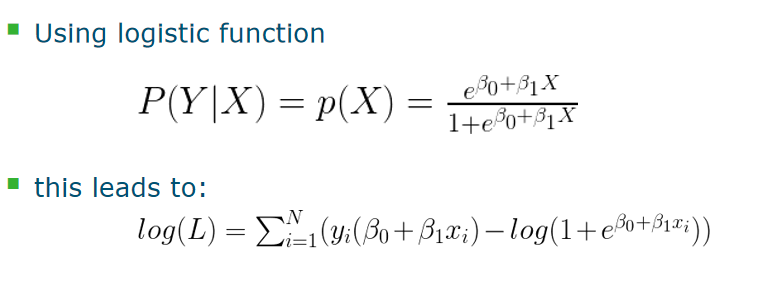
最后:
当log(L)的负值最小(NLL negativate log-likelihood)的时候,或者Log-likelihood 的值最大的时候(就是越大越好,但是值是负的),逻辑函数通过优化算法(literative algorithm)之后,找到最好的b1,b2这些参数。
 这个式子的变形是:log (p /1−p) = β0 + β1X1 + β2X2 这里面的p的含义是
  这个才我们要maximize的
Some Consideration
Interpretation of coefficient
跟Linear regression 差不多,instead of t-statistic, we use Z-statistic
Stability of parameter estimates
problem:
当模型参数的值发生变化时,模型的预测结果也会发生变化。如果模型参数的变化很大,那么模型的预测结果也可能会变得不稳定,即使输入数据没有变化。这种情况下,模型的参数估计是不稳定的。
solution:
regularization 通过在模型的损失函数中添加一个正则化项(regularization term),来限制模型参数的大小。这样可以降低模型参数的变化幅度,提高模型的稳定性。常用的正则化方法包括L1正则化(Lasso)和L2正则化(Ridge)等。
Multiple predictors
confounding
- confounding: a third variable (not the independent or dependent variable of interest) distorts the observed relationship between the variables of interest
- 为什么在引入income 变量之前student 的coefficient是正的,但是没引入这个变量之前student的coefficient是负的? 因为:confounding
Multinomial logistic regression
![[Pasted image 20240214222136.png]]
Softmax regression
Exercise ![[Pasted image 20240214222524.png]] (b)log (p /1−p) = β0 + β1X1 + β2X2
Recap:
Prediction of categorical Y given its features X is called…..classification Logistic regression: assume linear function for ……odds Parameter estimation: maximum likehood
文档信息
- 本文作者:Xinyi He
- 本文链接:https://buliangzhang24.github.io/2024/02/05/MachineLearning-3.Logistic-Regression/
- 版权声明:自由转载-非商用-非衍生-保持署名(创意共享3.0许可证)
